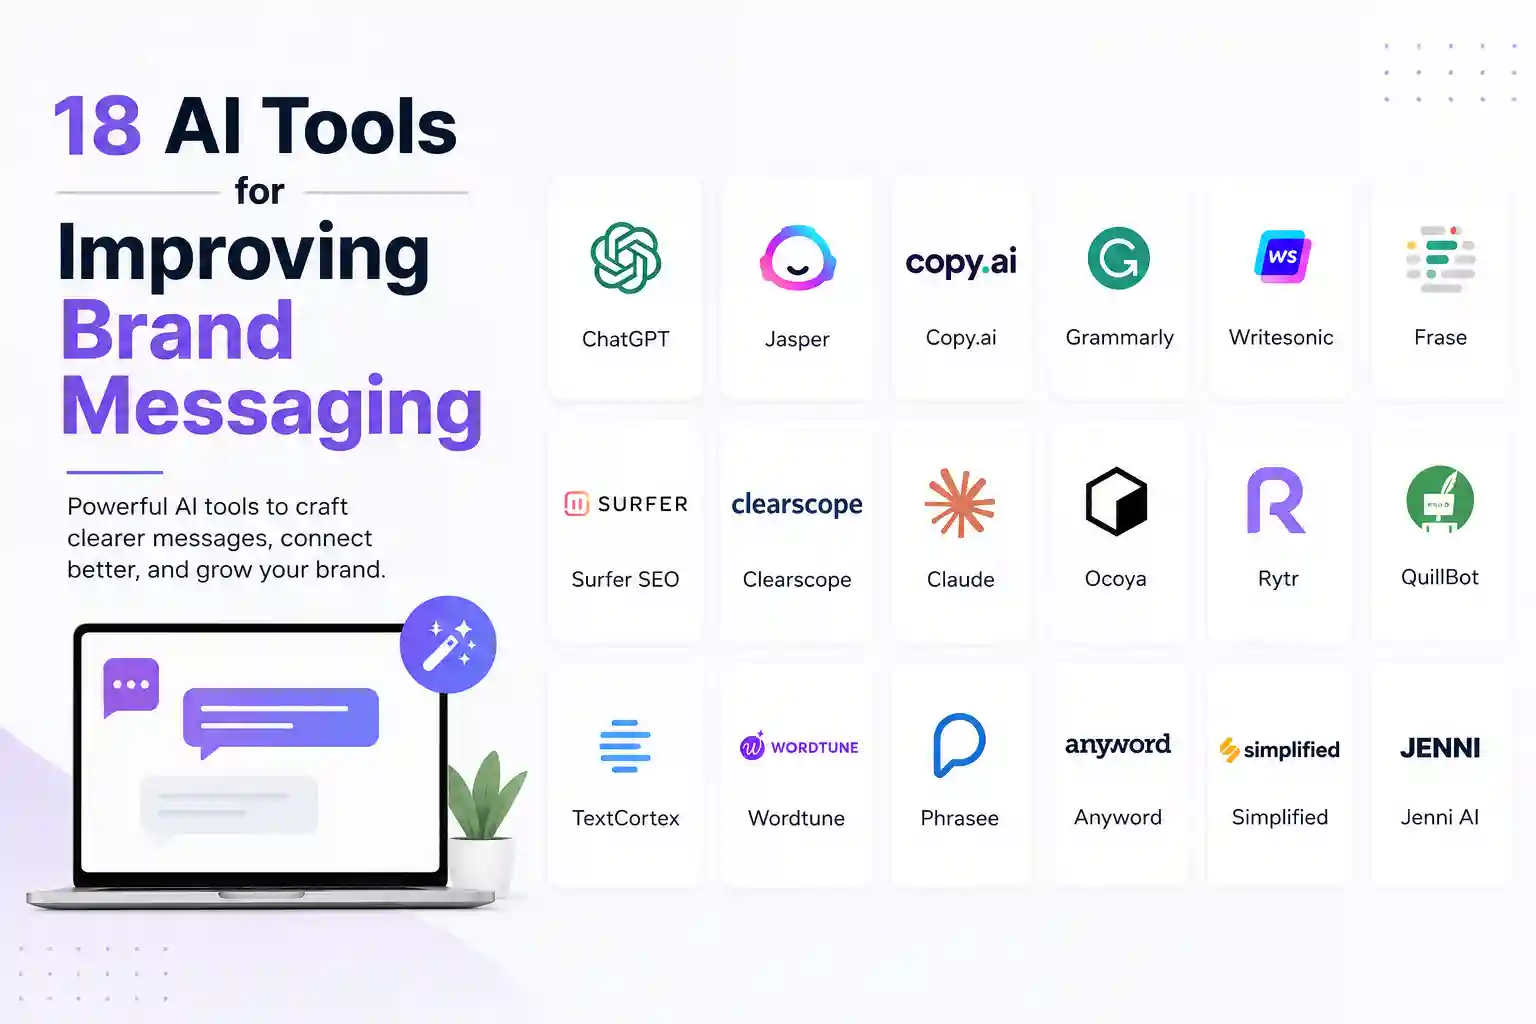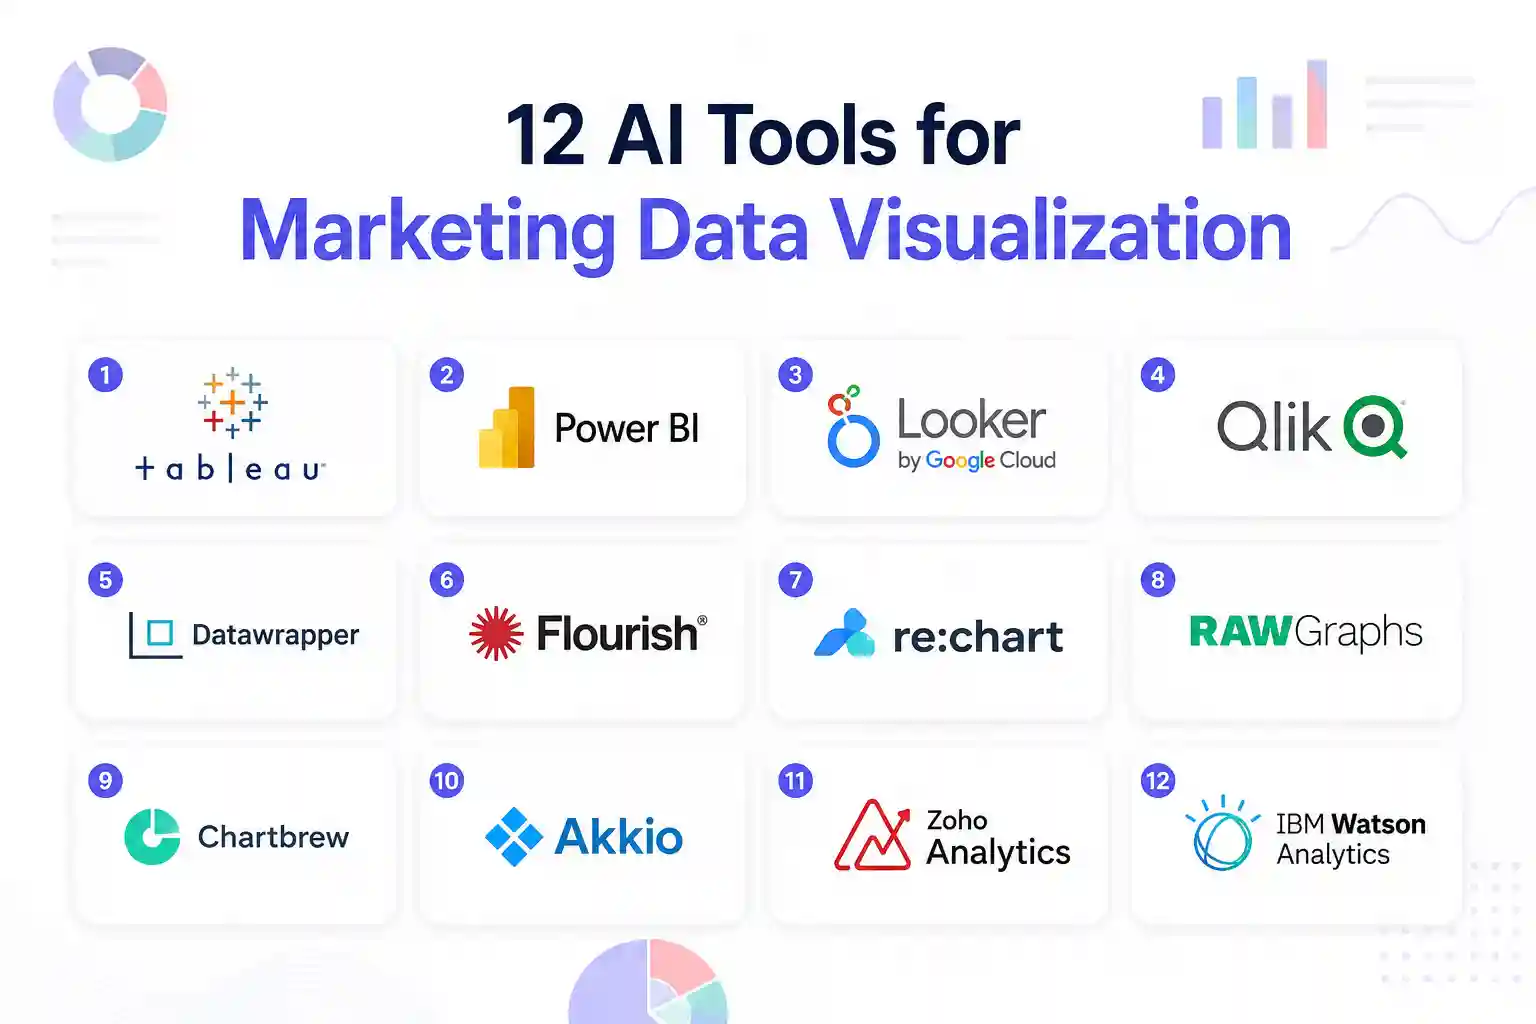
Why Data Visualization Matters in Modern Marketing
Marketers today juggle dozens of metrics from click‑through rates to customer lifetime value. Without a clear visual story, those numbers stay buried in spreadsheets, and opportunities slip away. That urgency is why AI tools for marketing data visualization have become a game‑changer: they turn raw data into instantly understandable charts, heatmaps, and interactive dashboards. In this guide, you’ll learn which tools deliver real‑world results, how to set them up quickly, and practical tips to keep your visuals accurate and compelling.
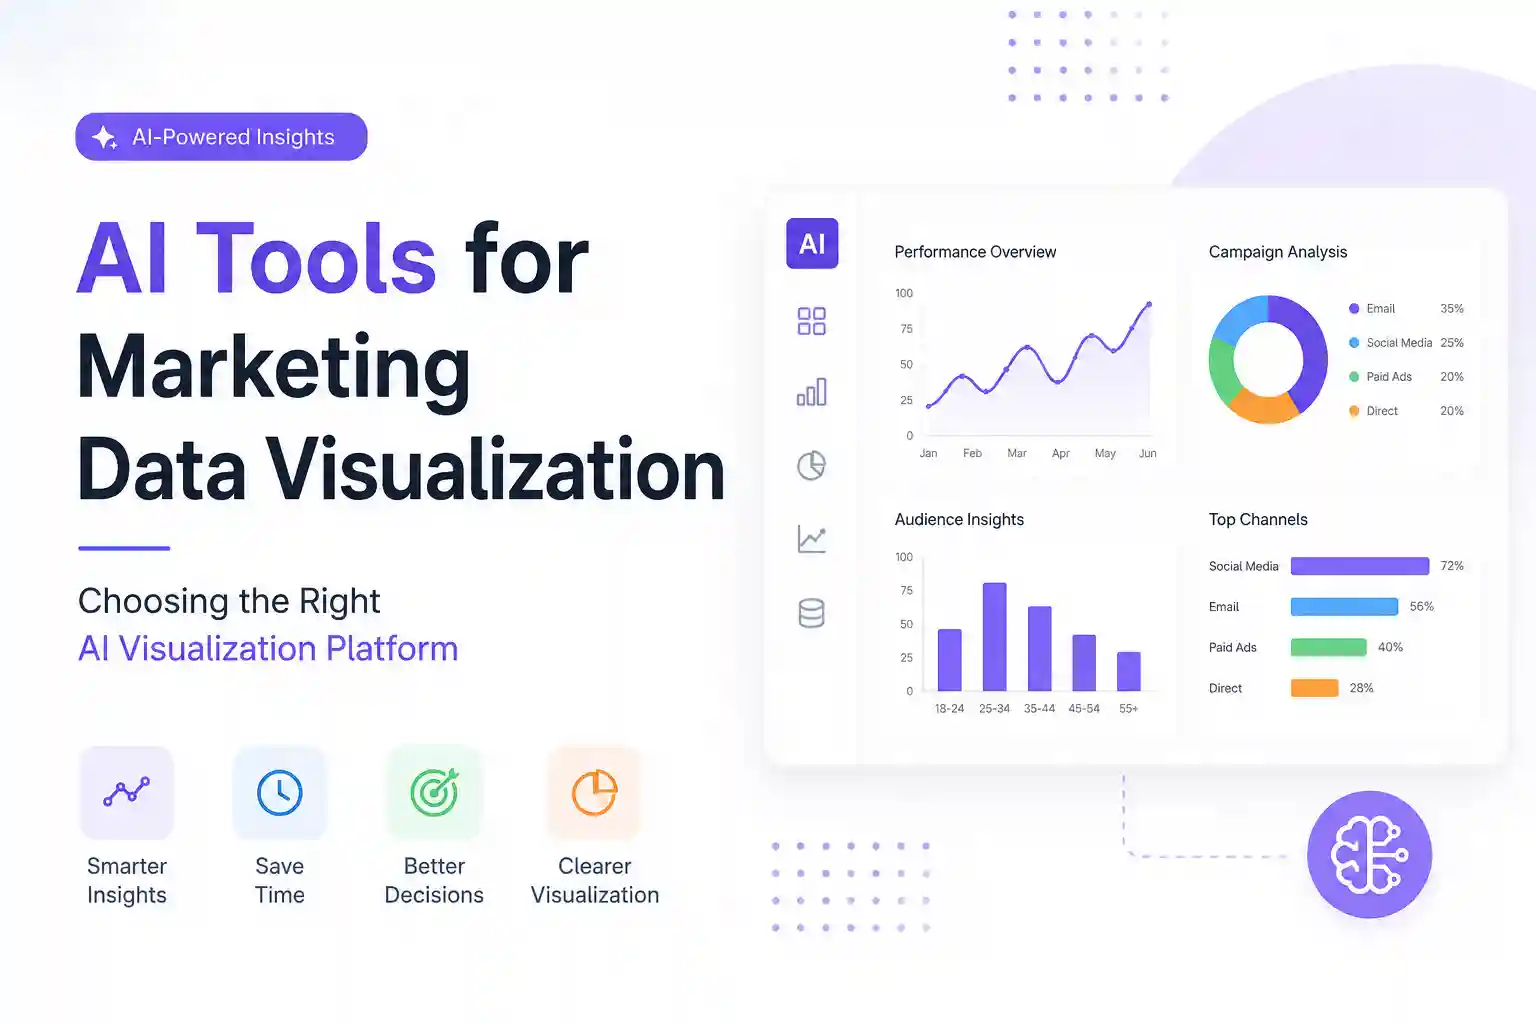
Choosing the Right AI Visualization Platform
Before diving into the list, consider three criteria that separate useful tools from flash‑in‑the‑pan gadgets:
- Data integration depth – Can the tool pull from CRM, ad platforms, and web analytics without manual exports?
- AI‑driven insights – Does it automatically suggest trends, anomalies, or segmentations?
- Collaboration features – Are dashboards shareable with stakeholders while preserving data security?
Using these checkpoints will help you avoid costly trial‑and‑error and ensure the tool fits your workflow.
1. Tableau with Einstein Discovery
Tableau is a veteran in business intelligence, and its integration with Salesforce Einstein adds a predictive layer. After connecting your ad spend and conversion data, Einstein highlights hidden patterns—like a sudden dip in ROI for a specific demographic—so you can act before the budget is wasted.
How to get started: Import your Google Ads and HubSpot data via native connectors, then enable Einstein’s “Explain Data” button on any chart. The AI will automatically generate a narrative that you can embed in presentations.
2. Power BI with Azure AI
Microsoft’s Power BI couples with Azure Cognitive Services to turn messy datasets into polished visuals. Its AI visualizations, such as key influencer charts, automatically rank factors that move your KPI the most.
Quick tip: Use the “Smart Narrative” feature after you build a funnel chart. The AI writes a concise summary you can copy into email updates, saving hours of manual reporting.
3. Looker Studio (formerly Data Studio) + Google AI
For marketers already in the Google ecosystem, Looker Studio offers a free, cloud‑based canvas. With the new AI‑assisted data blending, you can merge YouTube, Search, and Social metrics in seconds and let the AI suggest the best chart type.
Action step: Activate the “Auto‑Chart” toggle in the data source panel. The AI will recommend a line, bar, or heatmap based on data distribution, cutting down on trial‑and‑error.
4. Qlik Sense with Insight Advisor
Qlik’s associative engine plus Insight Advisor lets you ask natural‑language questions like, “Show me the top three channels driving conversions last month.” The AI instantly builds a visual answer, which you can refine with drag‑and‑drop filters.
Best practice: Tag your data fields with business terminology (e.g., “Cost per Acquisition”) so the AI understands the context and avoids misinterpretation.
5. Domo with Beast Mode AI
Domo’s Beast Mode lets you write custom formulas, and its AI layer suggests optimizations based on usage patterns. When you create a sales‑by‑region map, the AI may propose adding a trend line or clustering outliers automatically.
Implementation tip: Turn on “Auto‑Suggest” in the visualization builder. The AI will surface heatmaps for geographic data without extra configuration.
6. Sisense Fusion AI
Sisense’s Fusion AI scans your entire data lake and surfaces visual templates that match your business case. For example, if you upload a CSV of email campaign metrics, Fusion will propose a stacked bar chart with AI‑generated segment labels.
How to use it: Upload your data, click “Generate Insight,” and then select the recommended visualization. You can fine‑tune colors and legends to match brand guidelines.
7. Chartio (now part of Atlassian) – AI Query Builder
Chartio’s AI Query Builder translates plain English into SQL queries, then renders the results as interactive charts. This is ideal for marketers who lack deep SQL knowledge but need precise cohort analysis.
Step‑by‑step: Type “Show monthly bounce rate for organic traffic” in the query bar. The AI builds the query, runs it, and displays a line chart ready for sharing.
8. Zoho Analytics with Zia AI
Zoho’s Zia AI can detect anomalies in real time. When a campaign’s click‑through rate spikes unexpectedly, Zia flags the outlier and suggests a visual drill‑down, such as a geographic heatmap.
Pro tip: Set up Zia alerts for key metrics like CPA. The AI will email you a snapshot chart the moment thresholds are crossed.
9. IBM Cognos Analytics
Cognos leverages IBM Watson to auto‑generate visual stories from raw datasets. Upload your multi‑channel performance file, and Watson will propose a narrative dashboard that includes trend lines, correlation matrices, and predictive forecasts.
Getting value fast: Use the “Story Builder” template. The AI arranges charts in a logical flow, which you can edit before publishing to executives.
10. ThoughtSpot Search & AI
ThoughtSpot’s search‑first approach lets you type questions like “What was the ROI of LinkedIn ads last quarter?” The AI instantly creates a bar chart and even suggests a forecast for the next quarter.
Actionable insight: Pin the AI‑generated chart to a shared dashboard and enable auto‑refresh every 24 hours to keep the team updated.
11. Klipfolio with AI Insights
Klipfolio offers a lightweight, cloud‑based dashboard builder. Its AI Insights module scans your metrics and proposes visualizations—especially useful for small teams juggling limited data sources.
Quick win: Connect your Facebook Ads API, then click “AI Suggest” on a new widget. The tool may recommend a funnel visualization that reveals drop‑off points across ad sets.
12. DataRobot Paxata
DataRobot’s Paxata focuses on data preparation, but its integrated AI visualizer turns cleaned data into interactive charts with a single click. Ideal for marketers who need to mash up offline survey data with online behavior.
How to apply: After blending the datasets, select “Auto‑Visualize.” The AI suggests a scatter plot with clustering that highlights high‑value customer segments.
Practical Tips to Maximize AI‑Powered Visuals
Even the smartest AI can mislead if you don’t apply basic best practices:
- Validate data sources before trusting AI suggestions; a single erroneous column can skew all charts.
- Keep visual simplicity—use one primary metric per chart to avoid cognitive overload.
- Regularly review AI alerts for anomalies; a spike might indicate a tracking error rather than a real performance change.
- Document assumptions in chart footnotes so stakeholders understand the AI’s reasoning.
Following these safeguards ensures your visualizations remain trustworthy and actionable.
Frequently Asked Questions
What is the biggest advantage of using AI for marketing visualizations?
AI speeds up the discovery phase by automatically spotting trends, anomalies, and correlations that would take hours of manual analysis. This lets marketers react faster and allocate budget more effectively.
Can I use these tools without a data science background?
Yes. Most platforms translate natural language queries into charts, and their AI assistants handle the heavy lifting. Basic familiarity with your data sources (e.g., Google Analytics) is enough to get meaningful results.
How much does a typical AI visualization tool cost?
Pricing varies widely. Free options like Looker Studio cover core needs, while enterprise solutions such as Tableau or Power BI can range from $70 to $150 per user per month. Many vendors offer tiered plans, so start with a trial to gauge ROI.
Is my marketing data safe when using cloud‑based AI tools?
Reputable platforms comply with GDPR, CCPA, and industry‑standard encryption. Always review the provider’s security certifications and enable two‑factor authentication for added protection.
Do I need to train the AI models for my specific industry?
Most tools come pre‑trained on generic marketing datasets. However, fine‑tuning—by feeding the AI your historical campaign data—improves accuracy, especially for niche verticals.
Integrating AI Visuals into Your Marketing Workflow
Start with a pilot project: pick one campaign, connect the data to an AI‑enabled dashboard, and set up automated alerts. After a month, evaluate the time saved and the quality. Scale gradually, adding more data sources and stakeholders as confidence grows.
Remember, AI visualizations are a supplement, not a replacement, for strategic thinking. Use the charts to spark discussions, then let your team decide on the next tactical move.
Author Bio
Hi, I’m Anik Hassan, a digital marketing and SEO specialist with over seven years of experience helping websites grow through smart content strategies and organic search optimization. I graduated in Computer Science and Software Engineering from IBAIS University in 2017.
Beyond marketing, I’m deeply passionate about the future of technology, especially quantum computing and Artificial Intelligence. I spend much of my time researching emerging innovations and exploring how advanced technologies are shaping the next generation of the digital world.
Availability and signup requirements may vary.